~/projects $ cat projects/mmg.md
OSRS Market Tools (MMG)
activePersonal
Money-making-guide and Grand Exchange analysis for Old School RuneScape: deterministic margin analytics plus a leakage-checked ML research track on public market data.
A local-first market-analysis product for Old School RuneScape's Grand Exchange: a deterministic price-margin analyzer (the money-making guide, 'MMG') plus a separate ML research track built around exact-horizon, walk-forward, leakage-checked evaluation with honest negative-result reporting.
try it
Runs entirely in your browser on live OSRS Wiki price data. No account needed.
Technologies
- Python
- Pandas
- OSRS Wiki API
Skills
- Time-series ML
- Evaluation methodology
- Data pipelines
- Full-stack development
Links
- 4,420 tradeable items scanned live; 627 money-making methods; 1.55M historical observations
- Direction prediction: 57.43% accuracy vs 54.86% baseline (95% CI 56.76 to 58.14)
- Next-day volatility: 30.4% MAE improvement over rolling baseline
- Tax-hurdle selection: 0.727 ROC-AUC, 2.65x precision lift
- Tax math audit: 50,512 browser vs backend comparisons, zero mismatches
Overview
MMG is two systems sharing one name: a live, deterministic Grand Exchange margin calculator that works today, and a machine-learning research track that spent about five weeks building a leakage-checked evaluation harness and then reported, plainly, that it could not yet turn short-horizon price prediction into a profitable automated trade. The calculator ships. The trading bot does not, on purpose.
Three static pages, money-making methods, GE flip scanner, and bankroll planner, run entirely in the browser against live OSRS Wiki price data at osrs-mmg-analyzer.pages.dev. Behind that, an optional local Python backend collects five-minute price bars around the clock, trains direction and magnitude models with walk-forward validation, and backtests every idea against the game's real trading tax before it is allowed anywhere near a UI. The research track's headline finding is a negative one, reached on three separate backtests using three different methods, and the project's response was to ship the parts that held up, risk and ranking signals, and park the part that did not, automated buy or sell signals.
The problem and motivation
Old School RuneScape is a two-decade-old MMO whose in-game economy runs on the Grand Exchange, a shared marketplace where prices move in real time as thousands of players buy and sell. Every completed sale is taxed 2% by the game itself, rounded down to the nearest coin and capped at 5,000,000 gp per item.
Two different questions sit inside that setup. The simple one: of the roughly 627 money-making methods and several thousand tradeable items, which ones are actually worth doing or flipping right now, given today's live prices? That has a deterministic answer, it just takes a lot of tedious arithmetic across live data, which is what the calculator does. The hard one: can short-horizon price movement be predicted well enough to trade automatically? That looks like an ordinary time-series machine-learning problem until the tax is added back in. A forecast that is directionally correct is not automatically profitable, because a round trip has to clear the tax plus the bid-ask spread plus slippage before it earns anything at all. Plenty of trading write-ups skip that last step and report a raw accuracy number instead. This project's research track exists specifically to not skip it.
System architecture and deployment
Three loosely coupled pieces make up MMG. A static frontend, three HTML pages for money-making methods, GE flipping, and bankroll planning, runs client-side against the public OSRS Wiki real-time prices API and deploys to Cloudflare Pages. It needs no backend for its core function: every price, margin, and tax calculation happens in the visitor's own browser. Behind that sits an optional local-first Python backend (FastAPI, port 8788) that owns the research and history: a collector daemon, a SQLite price archive, the feature and label builders, the trained models, and a drift monitor. A small accounts microservice for login and session storage is a separate, still-early piece.
The split exists because of one hard constraint: a browser on the deployed https site cannot call an http localhost API. Browsers block that outright as mixed content. So anything that depends on the local backend, trend history, GE history, the planner's sync features, the ML layer, only works when a visitor is also running the local server on their own machine. The deployed site says so plainly and degrades without layout shift rather than silently failing or faking data. That tradeoff keeps the free, always-on part of the product simple and fast, and keeps the more experimental ML research track off the public internet entirely, which also means never serving a live trade signal to a stranger's browser.
architecture · mmg · the static frontend also reads live prices directly from the public API at the top, independent of the collector and model pipeline below it
Data collection and processing
A collector daemon polls the OSRS Wiki API continuously for 5-minute, 1-hour, and daily price bars, rate-limited to roughly 0.8 requests per second, comfortably under the API's acceptable-use guidance. Every write is idempotent (INSERT OR IGNORE on composite keys), so a crash or restart never duplicates or corrupts data, and the collector re-runs its gap-repair routine on startup and again every hour, so an outage self-heals on the next cycle instead of leaving a permanent hole. The 30-day backfill that seeded the intraday research track cost about 8,450 API requests over roughly 2.9 hours.
The archive itself is SQLite: a price_5m table (never pruned), a price_1h table, and a daily_history table (top 100 items, back to roughly 2015 via Weird Gloop's historical data). Separate audit tables, fetch logs, data-quality issues, latest ticks, are pruned after 90 days, for operational monitoring rather than the historical record. That split is deliberate: the collector compounds across sessions instead of starting over. Run a deeper backfill whenever more history is wanted, and the archive grows. A separate pipeline compacts completed days into Zstandard-compressed Parquet via DuckDB, and a dedicated export step snapshots immutable Parquet datasets for ML experiments, so a model run always reads a frozen file instead of a live, changing database. Data quality is enforced by exclusion, not repair: in one validation pass on 1,646 five-minute local rows, 1,051 were missing one side of the market and 37 had inverted high and low values, all dropped rather than patched.
The ML and analytical components
The feature set is 14 columns computed per item per 5-minute bucket: spread percentage, 1/3/12-bar lagged returns, EMA ratios, RSI, MACD, a Bollinger z-score, volume, cyclical hour-of-day and day-of-week (sine/cosine encoded, so 11pm and midnight read as neighbors instead of opposite ends of a number line), log price, and a liquidity tier. A direction classifier sits on top of those features, estimating the probability that an item's midpoint return will be at least 1% over a 4-hour horizon, trained as LightGBM when available and falling back to scikit-learn's HistGradientBoosting with matched hyperparameters otherwise, so the pipeline degrades instead of breaking on a machine without LightGBM. Three quantile regressors (10th, 50th, 90th percentile) estimate the size of the move, calibrated with isotonic regression and widened by conformal residual adjustment (the 90th percentile of held-out residuals), so the uncertainty band is honest rather than just narrow-looking.
A third model, a tax-hurdle classifier predicting whether a trade clears tax, spread, and slippage combined, was built and evaluated on both tracks but never shipped. On the corrected intraday dataset, clearing that whole wall happens in only about 2.2% of examples, an extremely imbalanced target before a model is even asked to rank them. The results section below covers what a backtest built on this class of model actually earns.
The models that shipped into product plans are narrower: volatility prediction (30.4% MAE improvement over a rolling baseline) and spread/margin-compression forecasting (6.2% MAE improvement, 0.582 Spearman rank correlation), both feeding risk and ranking surfaces, not trade signals. A champion/challenger process scored on Brier skill, and a Population Stability Index drift monitor (calendar features excluded, since day-of-week and hour shift regardless of market regime), sit underneath it all, falling back to a simple deterministic flip score whenever a model is judged degraded.
Decisions and tradeoffs
The single biggest decision is to park automated trade signals and ship risk and ranking features instead. Three independent backtests agreed that trading loses after tax (numbers below). The response was to keep the champion and drift-monitoring plumbing wired up and honest, and hold every trade signal out of the UI until it clears a specific graduation gate: a positive backtest under conservative, liquidity-stratified fills across multiple regimes, confirmed in paper trading. Nothing has cleared that gate yet.
A second decision follows from the first: a signal should know when to abstain rather than always offer an opinion. Live scoring produced 725 predictions, narrowed to 18 candidate signals, and all 18 were suppressed, mostly by a staleness gate, since scoring ran without a live collector and the newest price bar was older than the 15-minute freshness cutoff. Always emitting a confidence-free best guess was rejected on purpose: in the project's own framing, a system that knows when to shut up is worth more than one that always has an opinion, especially when the downside of a bad opinion is a stranger's in-game gold.
Two infrastructure decisions are quieter but just as deliberate. The SQLite archive never prunes its three core price tables; only the audit tables get a 90-day retention window, since the point of a continuous collector is a compounding record, not a rolling cache. Every model evaluation also uses walk-forward splits with an embargo at least as long as the prediction horizon, rather than a random split, to keep a label's future window from leaking backward into training.
The last major tradeoff is architectural: a static frontend paired with an optional local backend, rather than one hosted backend serving every visitor. A hosted, always-on backend would reach everyone, but it would mean paying to run it, securing it, and taking on the liability of pushing a live trade recommendation to a stranger. Keeping the backend local-only costs real functionality for visitors who never run it, but keeps the free part of the product simple and fast, and keeps every experimental ML surface off the public internet by construction.
Experiments and results
Every headline number below has a stated baseline; an improvement without one is not a result. The daily feasibility study (a public Kaggle snapshot of GE prices, 1.55 million observations across 4,420 items, 2021-2026) found 57.43% direction accuracy against a 54.86% majority-class baseline, a 2.51-2.90 percentage point edge across all three walk-forward regimes tested. A tax-hurdle classifier trained on the same data, flagging moves likely to clear the full cost of trading, reached a 0.727 ROC-AUC and 45.7% precision on its selected calls against a 17.2% base rate, a real 2.65x lift. None of that skill survived an actual backtest: acting on the model's picks lost 1,529,993 gp across 1,629 trades, a 33.7% win rate and a -3.06% mean trade ROI. The verdict at the time was blunt: no profitability claim, automation, or live "buy now" badge was warranted.
A follow-up intraday experiment on 30 days of real 5-minute data (12,989,122 rows, roughly 1,200 liquid items) found a stronger signal: 74.0% direction accuracy against a 68.5% base rate (always guessing "down"), a +5.5 percentage point edge, and a Brier skill of +0.19, meaning the model's confidence levels carried real information, not just its yes-or-no calls. A mechanical trading rule built to test whether that skill was tradeable, a 12/48-bar EMA crossover, lost 75,099,719 gp across 47,203 trades: a 21.2% win rate, a profit factor of 0.14, a -5.1% mean return per trade. The project's own write-up puts the lesson bluntly: a forecast has to be correct by "more than the toll," not just correct.
That same week, an audit of the horizon-48 labeling convention used to build the intraday model, treating "48 bars later" as "4 hours later," found it was only true when the data had no gaps. Scanning 839,687 rows across the top 100 items by volume turned up 22,830 interior gaps; of the 834,887 labels built by counting 48 rows forward, only 580,076, 69.48%, actually landed 14,400 seconds (4 real hours) later. The audit's own metaphor: counting 48 buses does not measure four hours if some buses never came. The fix joins every label at the exact wall-clock offset instead of a row count, restarting rolling features at every gap. The result is smaller, 802,443 rows across 789 items, but every label means exactly what its name says. On that corrected data the risk-oriented models held up (volatility improved 30.4% over a rolling baseline; spread improved 6.2%, 0.582 rank correlation) while a net-of-everything tax-hurdle classifier still cleared the full cost wall in only about 2.2% of cases. Risk and ranking survived rebuilding the dataset from scratch. Automated trading did not.
Three figures from the ML research track, not the live margin analyzer. All three report the honest negative alongside anything that worked, matching the reports' own verdicts.
The phantom-spread debunk: what happens when you charge realistic fills
Same model signals, 30-day out-of-sample walk-forward, three different assumptions about which side of the spread a fill actually lands on. The net swings from a 22.9M gp "profit" to a 22.6M gp loss without changing the model at all, only the fill assumption. Two naive baselines (EMA crossover, random entry) are included for scale, under the same optimistic fills.
| Fill assumption (same model) | Trades | Net P&L | Win rate | Mean return / trade |
|---|---|---|---|---|
| Optimistic (buy avg_low / sell avg_high) | 29,696 | +22,905,763 gp | 67.1% | +24.71% |
| Mid-to-mid (pure direction, no spread) | 18,811 | -2,381,373 gp | 48.5% | n/a |
| Conservative (buy avg_high / sell avg_low) | 18,811 | -22,599,590 gp | 26.0% | n/a |
| Naive baseline (optimistic fills) | Net P&L | Win rate |
|---|---|---|
| EMA-cross | -61,714,074 gp | 21.4% |
| Random | -44,516,966 gp | 35.0% |
verdict, model_backtest.json
"SPREAD-CAPTURE ARTIFACT: model profit exists only under optimistic fills… NOT a validated trading edge."
results · mmg · backend/data/research/results/model_backtest.json
Objective reframe: taker vs. market-maker (the alternative that was rejected, and why)
The taker framing (buy the ask, dump the bid, a 2.2% positive rate) forces a class weight of roughly 20 to one that the calibrator can't rescue, negative Brier skill, high AUC that doesn't translate into usable probabilities. Reframing the same features around posting both sides of the spread (a 31.8% positive rate, closer to balanced) fixes calibration without changing what the model can see.
| Target (base features) | AUC | AP (base rate) | Brier skill | Verdict |
|---|---|---|---|---|
| Taker net-positive (v2)buy the ask, dump the bid | 0.869 | 0.215 (2.2%) | -1.28 | high AUC, broken calibration |
| Market-maker net-positivepost bid at avg_low, ask at avg_high, minus tax | 0.844 | 0.698 (31.8%) | +0.24 | calibrated + discriminating |
On the market-maker target, the model beats the obvious naive heuristic (just rank items by current spread) rather than only beating a coin flip:
| Market-maker net-positive | AUC | AP | AP lift |
|---|---|---|---|
| Model (LightGBM) | 0.844 | 0.698 | 2.20x |
| Spread-only heuristic (rank by spread_pct) | 0.712 | 0.474 | 1.49x |
results · mmg · reports/PHASE_A_RESULTS_2026-07-04.md
Model performance summary, daily-horizon research track
A separate research track on daily bars, same walk-forward, purge-and-embargo discipline as the intraday backtest above. Four sections: return regression against a persistence baseline, two classification targets, risk/spread forecasting against naive baselines, and a 3-regime walk-forward stability check.
Return regression, liquid-universe test set
| Model | MAE | Directional accuracy |
|---|---|---|
| Persistence (naive baseline) | 2.707% | 54.86% |
| Scaled SMA trend | 2.705% | 52.84% |
| Ridge | 2.711% | 50.25% |
| LightGBM Huber | 2.685% | 50.79% |
LightGBM Huber RMSE 4.873% vs. persistence RMSE 5.066%, a 0.81% MAE skill improvement over the naive baseline. Ridge and LightGBM both trail persistence on raw directional accuracy despite the MAE improvement, an honest mixed result, not a clean win.
Classification
| Target | Accuracy | Balanced acc. | ROC-AUC | Brier | Precision | Recall |
|---|---|---|---|---|---|---|
| Next-midpoint-up | 57.43% | 55.45% | 0.594 | 0.239 | 54.40% | 35.13% |
| Rise > 2.1% (tax hurdle) | 82.13% | 57.21% | 0.727 | n/a | 45.67% | 19.17% |
Risk and spread forecasting vs. naive baselines
| Task | Naive MAE | Model MAE | Improvement | Rank corr. |
|---|---|---|---|---|
| Absolute next-return (volatility) | 2.929% | 2.039% | 30.4% | 0.493 |
| Next spread | 2.051% | 1.924% | 6.2% | 0.582 |
Walk-forward, 3 regimes
| Regime | Direction AUC | Accuracy lift vs. majority baseline |
|---|---|---|
| Regime 1 | 0.576 | +2.51 pp |
| Regime 2 | 0.588 | +2.90 pp |
| Regime 3 | 0.594 | +2.57 pp |
Direction AUC and accuracy lift over the majority-class baseline are both positive in every one of the 3 regimes tested, small but consistent, not a fluke of one lucky split.
results · mmg · backend/data/research/results/daily_model_metrics.json
Lessons learned and current limitations
The clearest transferable lesson is that accuracy is not skill on an imbalanced problem. Guessing the majority class ("down") scores 68.5% with zero skill, so the honest scorekeeper is Brier skill against that base rate, not raw accuracy. The second lesson follows from the tax-hurdle numbers above: forecast skill is not profit, since a taxed, spread-crossing market has a real toll booth, and being right by a small margin when the toll is larger is still a loss. The third is that an abstaining system can be worth more than an opinionated one: live scoring suppressed all 18 of its candidate signals rather than guess on stale data, and that gate is treated as a feature, not something to route around. A fourth, smaller lesson shaped the data pipeline: when part of a validation sample turned out to have inverted high and low prices, those rows were dropped, not patched, on the theory that a data-quality guard should report anomalies rather than quietly repair them.
None of that changes what is not yet true. No autonomous trade signal is live anywhere in the product; the risk-oriented models are the only ML surface that shipped. The ML layer, GE history, and planner sync all depend on the local backend, so they do not exist for a visitor who has not started it, by design rather than by bug. Roughly 30% of items have gaps in their 5-minute bars at any given time, which is what forced the exact-horizon rework and still limits how much of the catalog gets a trustworthy label. The current models were trained on the initial 30-day backfill; more history should only help, but that has not been tested yet. An accounts and subscriptions system, login and server-side sessions, is mid-build on a separate branch, not part of the live site today.
Future directions
The stated flagship feature is capital allocation across the whole product, not just within one page: ranking "flip this item" against "run this money-making method" as competing uses of the same bankroll and the same hour, something no other GE tool does, because no other tool owns both datasets already. The risk and ranking layer, volatility, spread compression, and opportunity ranking, is planned to ship directly into the flip scanner and dashboard now that the intraday research confirms it is feasible; the trade-signal stack stays parked until it clears its own graduation gate. Dedicated item pages come after that, a feature every competing GE tool already has.
On the data side, the plan is a canonical 1-hour backfill back to March 2021, roughly 46,000 polite API requests, to replace the one-time Kaggle snapshot as the primary training corpus rather than a cross-check. Consolidation work is scoped but not urgent: settle on dashboard.html as the one operational surface, decide whether to retire a separate Streamlit ops dashboard, and merge the daily and intraday model stacks once the intraday side has enough real collected history of its own to stand on. Separately, an accounts and subscriptions system, login, server-side sessions, cached browser access, is in progress on its own branch.
Experiments
3 experiment write-ups · continued development log
Setup
Built a daily-bar research dataset from a public Kaggle snapshot of GE prices (CC BY 4.0, 1.55 million observations across 4,420 items, 2021-2026), cross-checked against 50 items from Weird Gloop's independent historical archive (60.2% daily-direction agreement, under 1% median price difference between the two sources). Trained a small family of models, a persistence baseline, a smoothed-trend model, ridge regression, gradient-boosted trees, a direction classifier, and a tax-hurdle classifier, on time-based splits with a purge-and-embargo gap between train and test windows. Separately audited the tax and fee math itself: 50,512 browser-versus-backend tax comparisons across every mapped item and boundary price, zero mismatches.
Result
Direction accuracy reached 57.43% against a 54.86% majority-class baseline, a 2.51-2.90 percentage point edge that held across all three walk-forward regimes tested, not one favorable split. The tax-hurdle classifier, trained to flag daily moves likely to clear the full cost of trading, reached a 0.727 ROC-AUC and 45.7% precision on its selected calls against a 17.2% base rate, a real 2.65x lift. None of that skill survived an actual backtest: acting on the model's picks lost 1,529,993 gp across 1,629 selected trades, a 33.7% win rate and a -3.06% mean trade ROI, and a separate uncertainty-abstention rule that let through only its single most confident trade also lost money on that one trade.
What it changed
The report's own verdict was blunt: no profitability claim, automation, or live "buy now" badge was warranted from this model. That verdict set the template the rest of the project followed: ship the risk-oriented results (volatility and spread forecasting, both genuinely useful), keep anything resembling a trade recommendation out of the product, and test the same question again on faster, higher-resolution data before drawing a final conclusion.
See it live
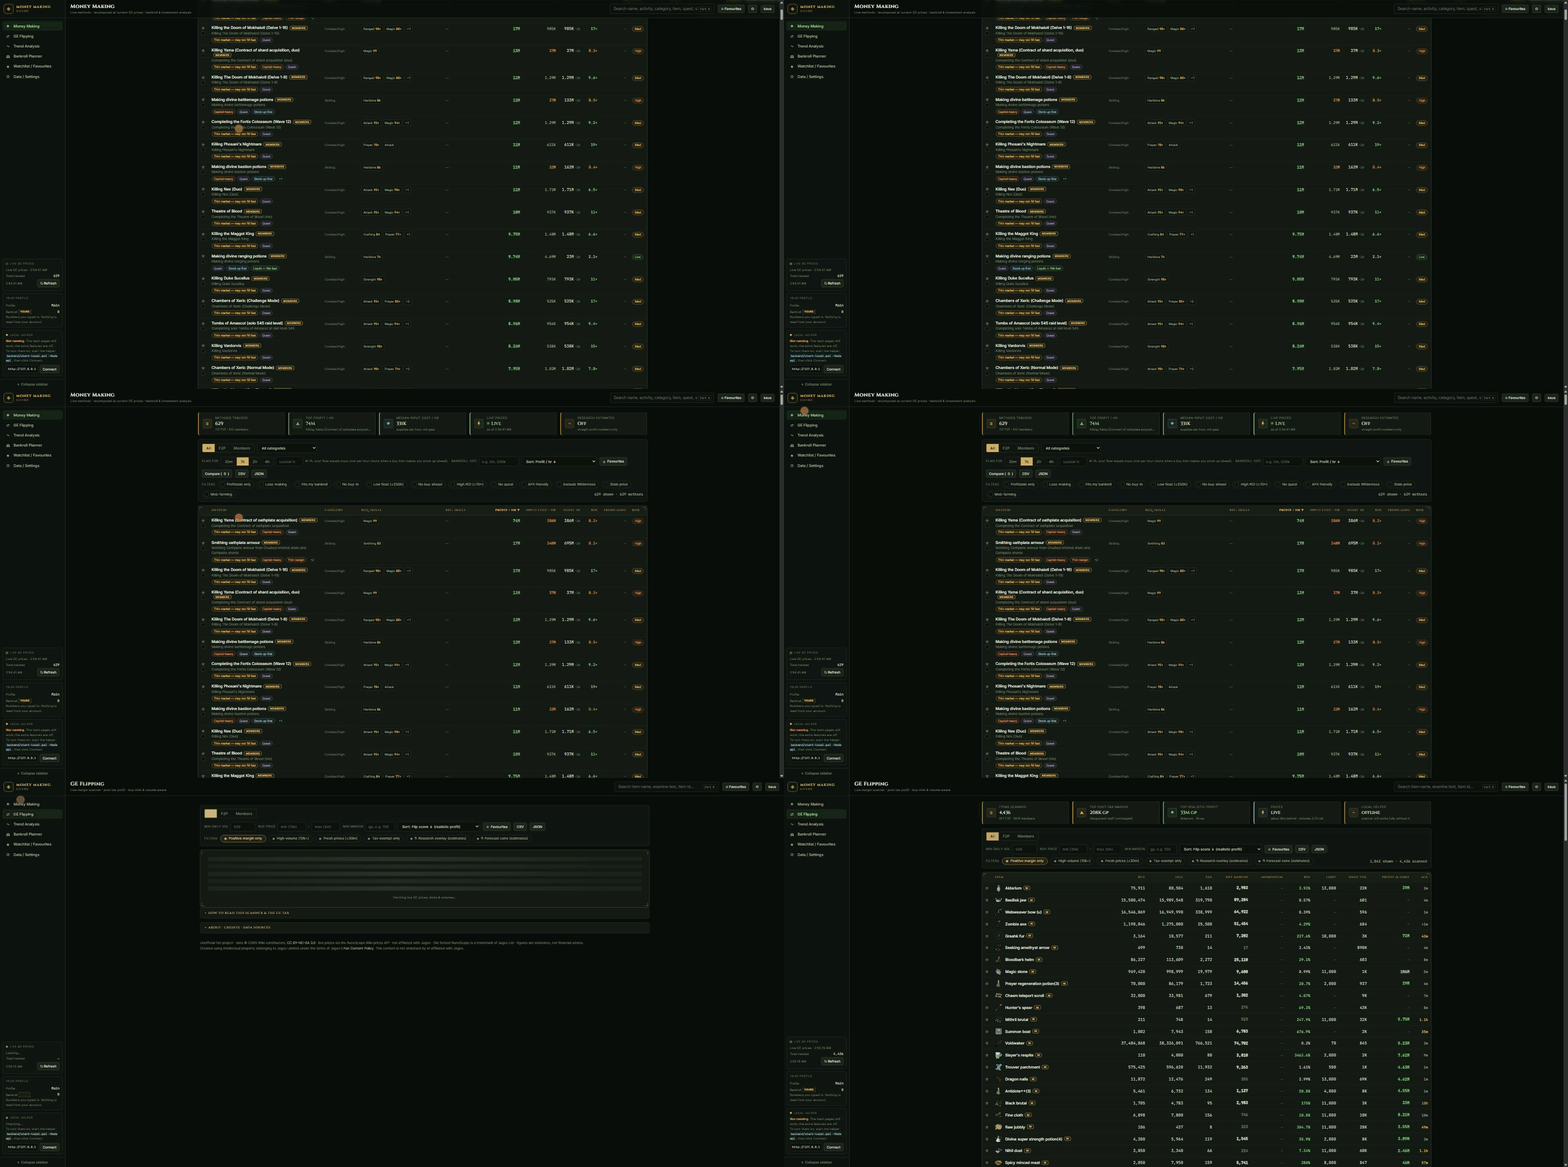
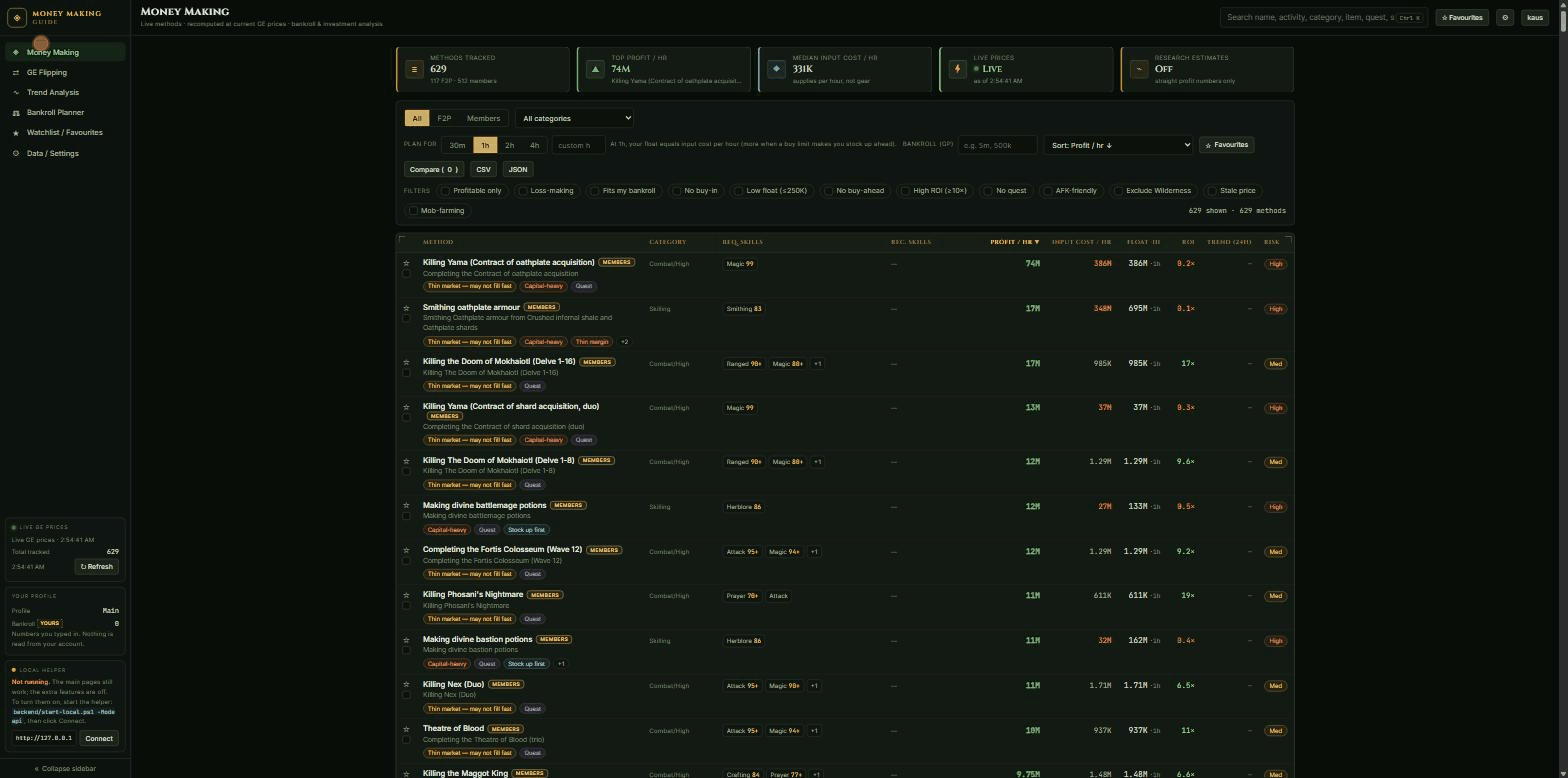
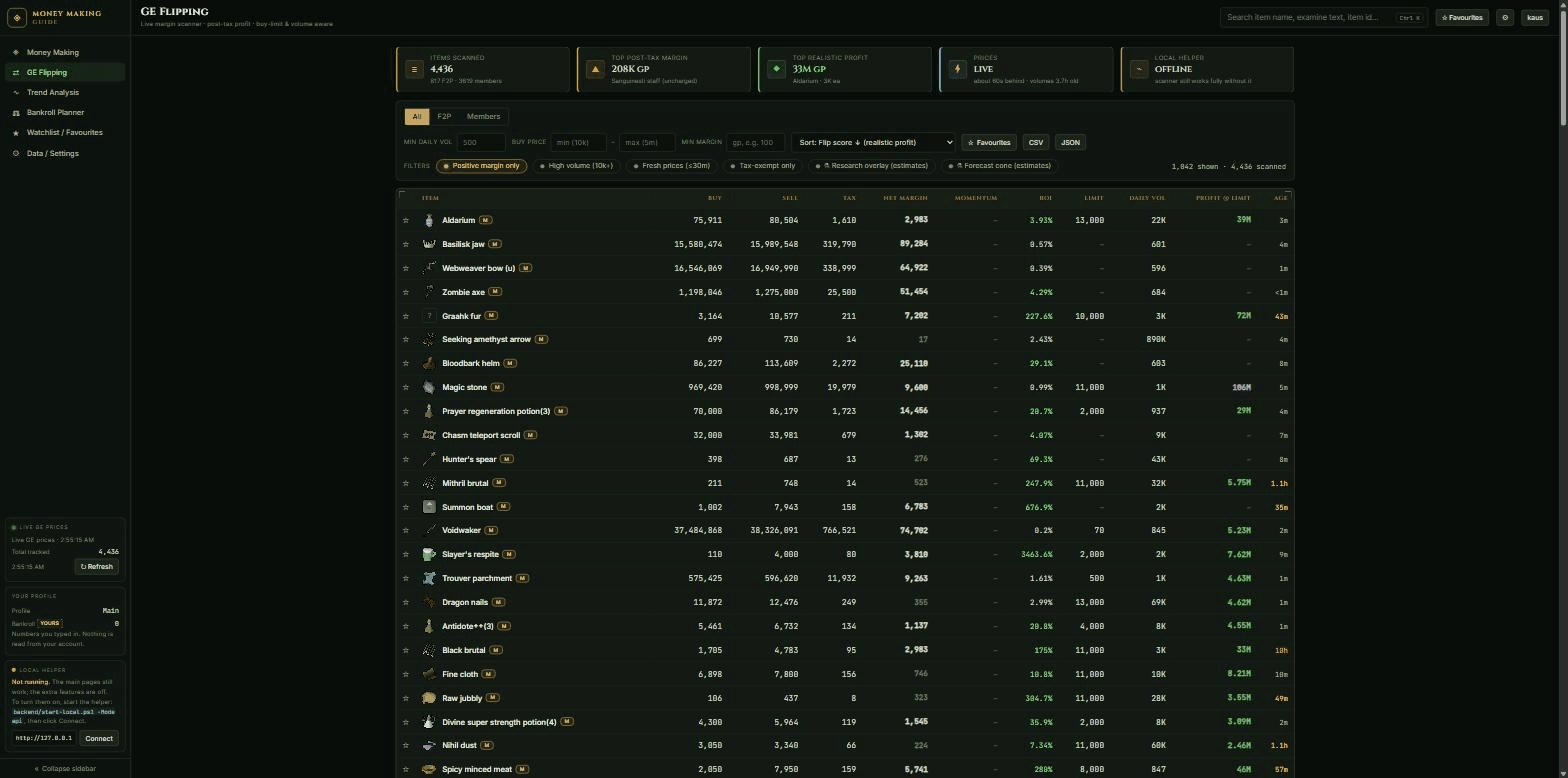
notes
- Unofficial fan tooling, not affiliated with or endorsed by Jagex. Old School RuneScape is a trademark of Jagex Ltd.
- Price data sourced from the community-run OSRS Wiki real-time prices API, with attribution. Figures can be stale or incomplete.
- Analysis and research only. No trading automation is exposed, and ML output is research-only, never a trade signal.